Research Portfolio
Education Researcher | Measurement & Evaluation | Analytics
Qi Sun
Research professional with 10+ years of experience conducting research on learning experiences, student success, and institutional effectiveness in higher education.M.S in Data Analytics and Visualization, Ed.D in Instructional Leadership, and MS.Ed in Childhood Education & TESOL.Currently exploring how human-AI collaboration can strengthen research, measurement, and learning
Recent Projects
Selected projects demonstrating research design, measurement, analytics, and researcher-AI collaboration in higher education.

Prompt Iteration Log
A shareable internal tool that enables non-technical colleagues document prompt development, search prompt histories, export prompt logs, and learn from previous prompt iterations

LLM-Assisted Survey Research Workflow
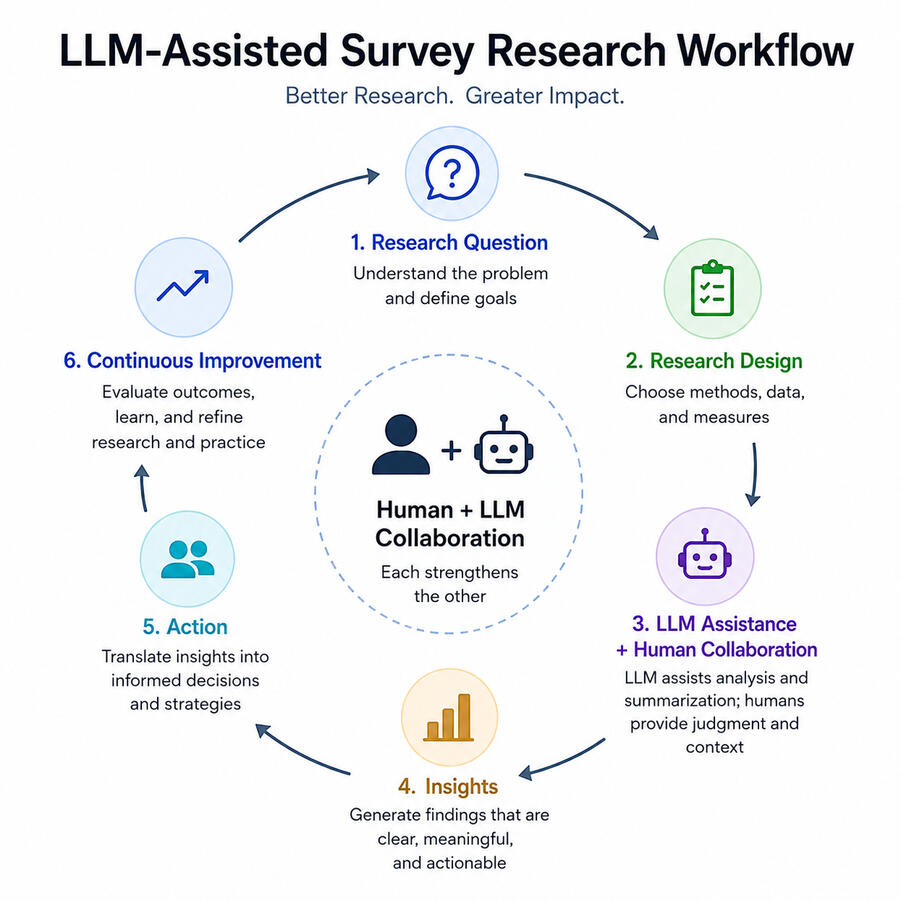
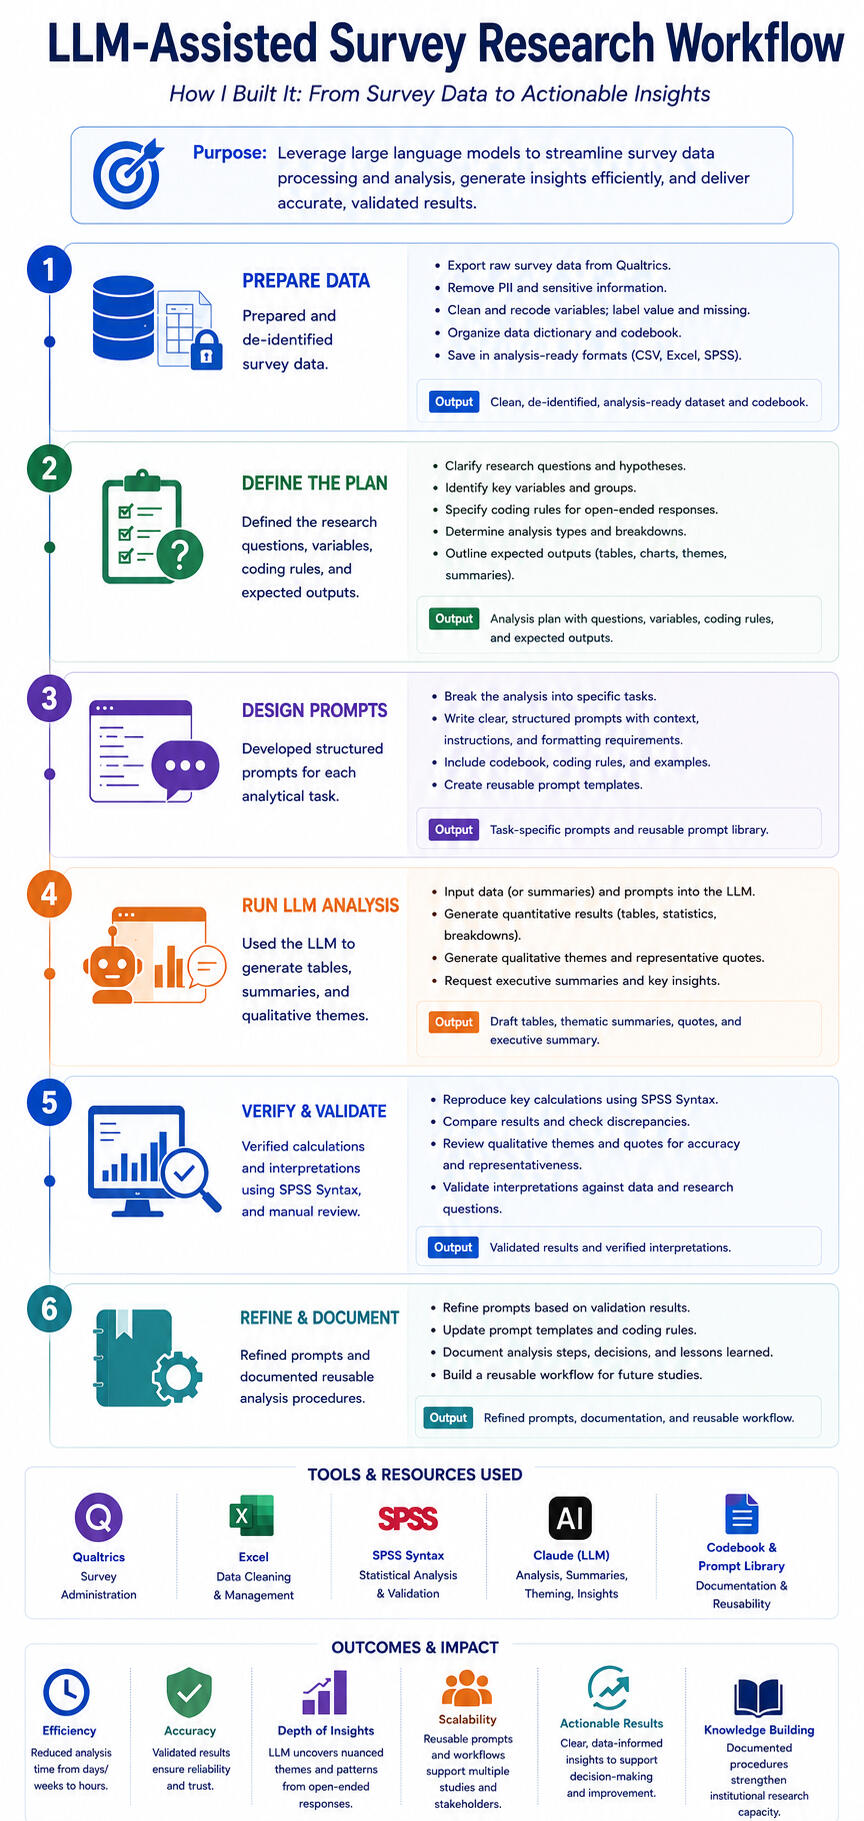
A reusable workflow that combines LLM-assisted analysis with researcher validation to streamline quantitative and qualitative analysis, reduce repetitive analytical work, and establish a structured approach for survey research

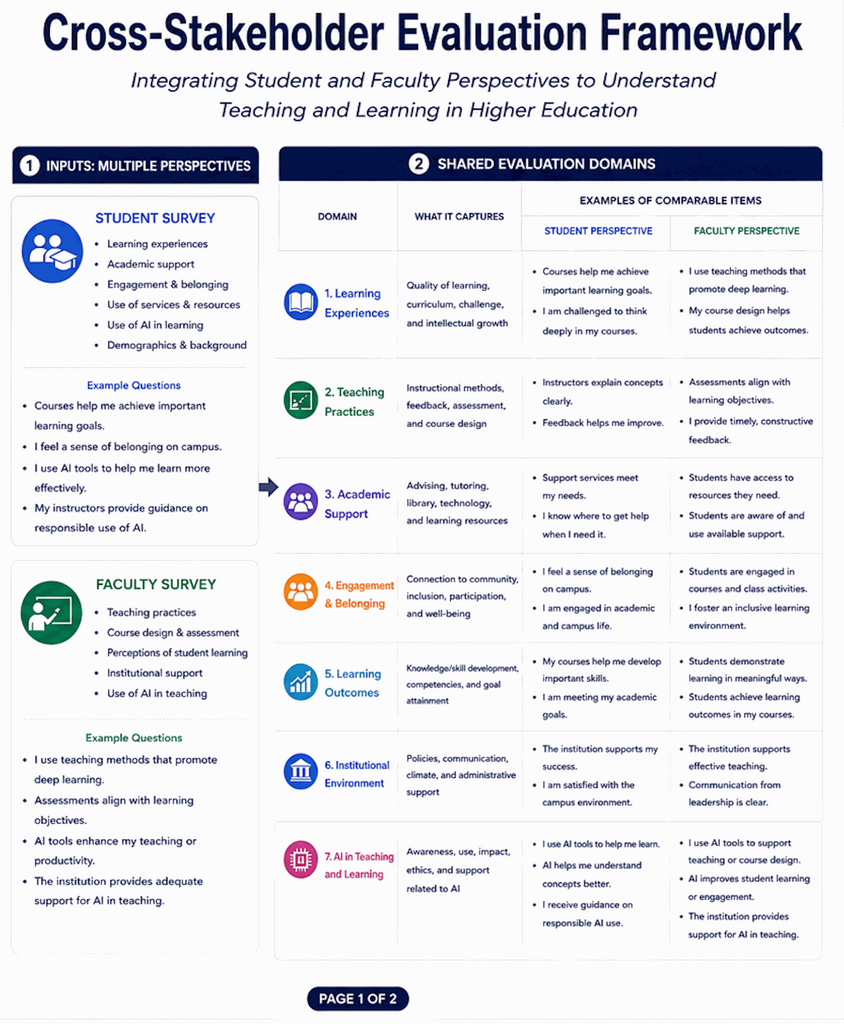
Cross-Stakeholder Evaluation Framework
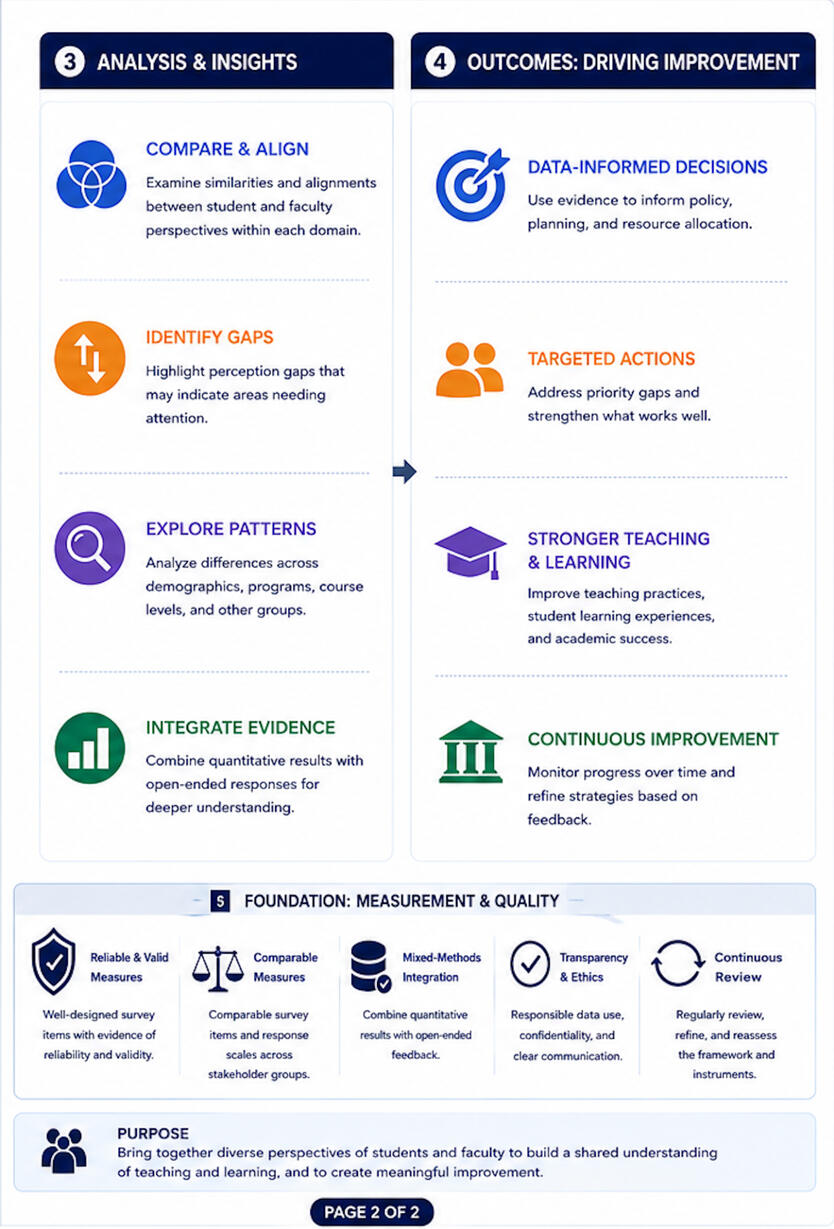
An evaluation framework that compares student and faculty perspectives on teaching, learning, and educational experience to identify perception gaps, align priorities, and inform institutional improvement

Longitudinal Student Outcome Measurement
A longitudinal measurement framework that combines AI-assisted data integration with researcher-led multidimensional analyses to examine multiple student outcome measures
Vibe Coding · Google Apps Script · Google Sheets ·
Google Sites · HTML · CSS · JavaScript
Prompt Iteration Log
• Problem:
As LLMs become increasingly adopted in institutional research offices, non-technical colleagues need simple ways to learn from previous prompt development and reuse validated prompts. However, prompt development is often iterative, and there was no systematic way to document why prompts changed, what problems each revision addressed, or which versions consistently produced reliable results. As a result, valuable prompts were difficult to share and were frequently recreated from scratch, making it harder for non-technical colleagues to use LLMs effectively for research tasks.• What I Built:
I built a simple and shareable internal tool consisting of two integrated components:
1) Prompt Iteration Log : Records every prompt revision together with the issue it addressed, compares each version with the previous iteration, identifies the final validated prompt, and captures metadata such as the AI model and contributor.
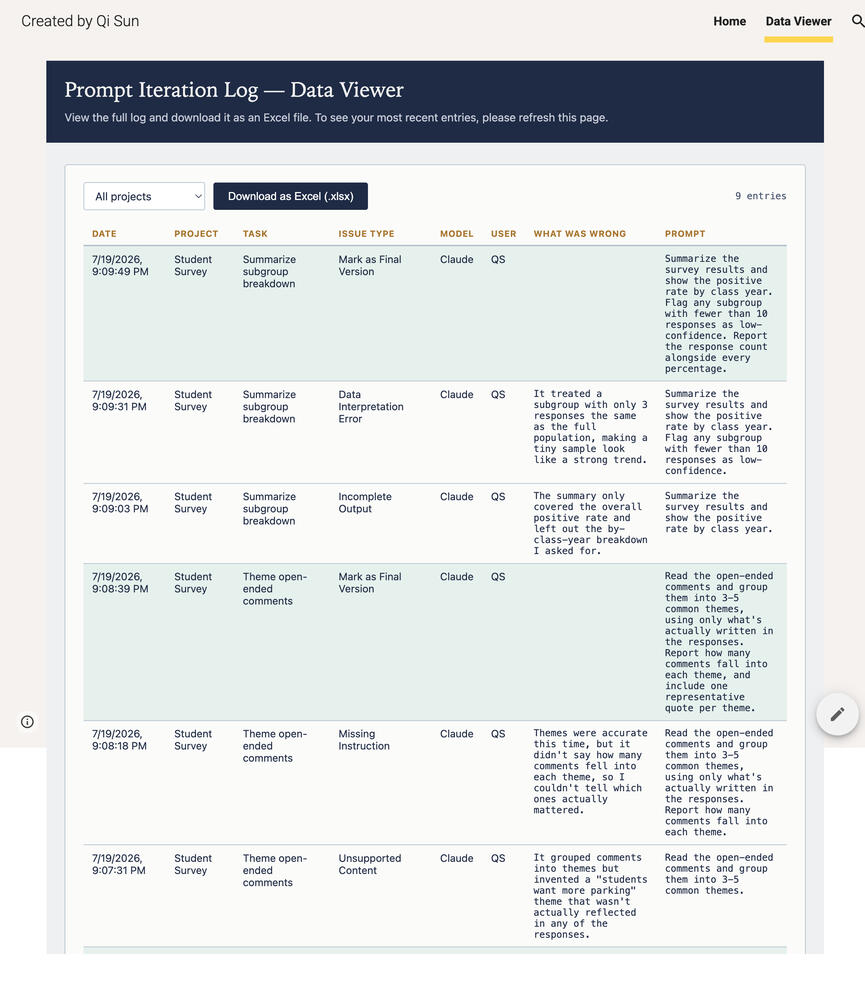
2) Data Viewer: Provides a searchable interface for reviewing prompt histories, identifying reusable prompts, and analyzing common iteration patterns across research projects. Users can export prompt logs to Excel.The system automatically generates summaries of prompt iteration histories, highlighting the most frequent issue types, the most iterated projects, and validated prompts for future reuse. Together, these features create a searchable knowledge base that supports more consistent and efficient AI-assisted research workflows.• Impact
- Enabled non-technical researchers to learn from previous prompt iterations
- Facilitated the reuse of validated prompts across research tasks
- Reduced the need to recreate prompts from scratch• Technologies:
Vibe Coding; Google Apps Script as a backend API; Google Sheets as the data store; Google Sites for web interface; Microsoft Teams for distribution.• Challenge:
The primary challenge was designing and implementing a web application without a traditional software engineering background. AI-generated code accelerated development but still required iterative testing, debugging, and refinement to ensure that the interface, backend logic, and data storage functioned reliably as an integrated system.• Future Improvement:
- Support keyword-based search across prompts and issue categories.
- Add dashboards to visualize prompt performance, common failure types, and iteration trends over time.• Reflection:
This project demonstrated that non-technical researchers can use AI-assisted development to build practical internal research tools. More importantly, it showed that effective prompt engineering depends not only on developing effective prompts but also on systematically capturing, validating, and sharing the knowledge generated through iterative refinement.
Tool:
https://sites.google.com/view/oir-prompt-log/home
Source Code:
https://github.com/susanqisun/Prompt-Iteration-Log
Figure 1. Prompt Iteration Log interface
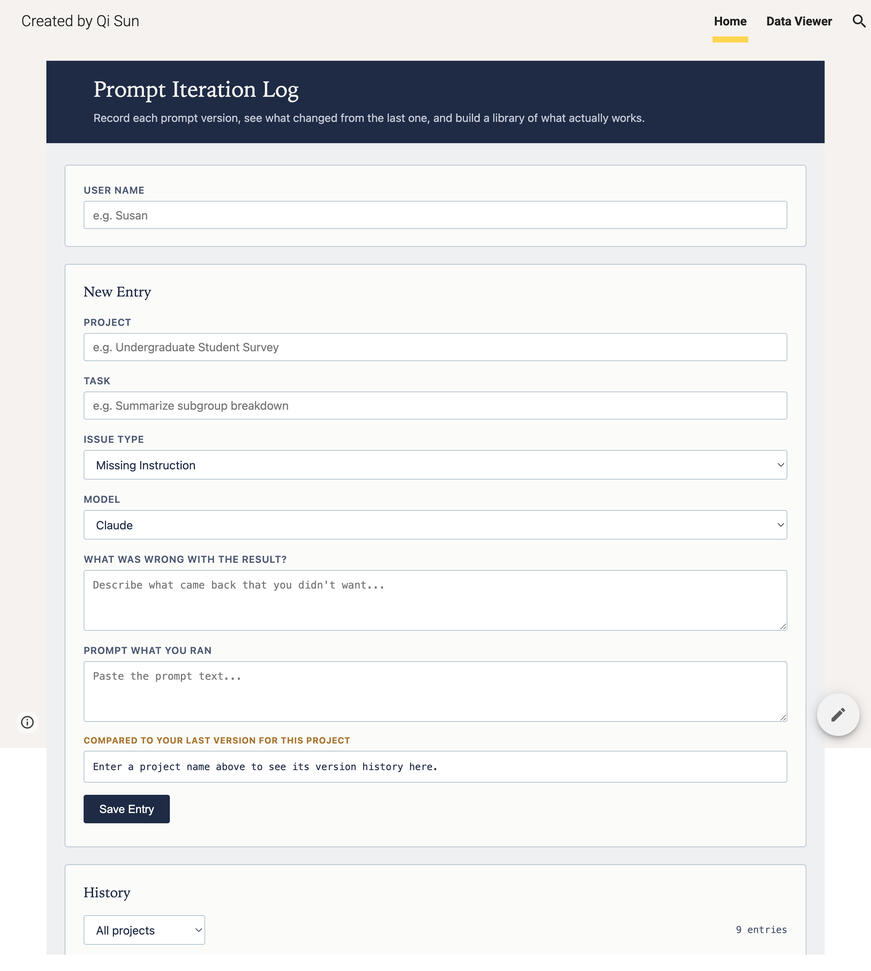
Figure 2. Data Viewer dashboard
Survey Research · Quantitative Analylsis ·
Qualitative Analysis · SPSS syntax· Claude ·
human-in-the-loop validation
LLM-Assisted Survey Research Workflow
• Problem:
Survey research often requires repeating the same analytical workflow across projects, including data cleaning, descriptive summaries, subgroup comparisons, statistical testing, and qualitative comment analysis. These analyses are time-consuming to reproduce using traditional tools such as SPSS or Python, while ad hoc use of LLMs can introduce calculation errors, inconsistent outputs, and unsupported interpretations.• Focus:
To develop a reusable survey research workflow that combines LLM-assisted analysis with researcher validation to streamline quantitative and qualitative analyses while maintaining research quality.• What I Built:
Developed a reusable LLM-assisted survey research workflow that automates repetitive analytical tasks while preserving human oversight. The workflow generated structured multi-sheet Excel reports, including descriptive summaries, subgroup comparisons, crosstab analyses, statistical results, qualitative theme summaries, and trend analyses.• Impact
- Reduced analysis time
- Improved workflow consistency
- Established a structured approach for integrating LLMs into survey research• Challenge:
The greatest challenge was ensuring research validity rather than simply generating results. LLMs could produce plausible outputs while misunderstanding variable definitions, subgroup coding, or analytical instructions. To address this, I systematically verified LLM-generated analyses against SPSS outputs before findings were incorporated into research reports.• Future Development:
Expand the workflow with standardized prompt libraries, validation checklists, and evaluation metrics for assessing LLM reliability across different survey designs. Future work will also extend qualitative coding to support substantially larger volumes of open-ended responses.• Reflection:
This project changed how I approach survey research. Instead of spending most of my time manually analyzing data, I now focus on designing the workflow, defining analytical requirements, and validating results. It showed that LLMs are most valuable when they support - not replace - research judgment. Also, I learned that successful human-AI collaboration depends less on the model itself and more on the research process around it. Clear instructions, structured workflows, and careful validation are essential for producing trustworthy results.
mixed-methods research · Survey design · measurement development · data analysis · visualization
Cross-Stakeholder Evaluation Framework
• This project explores four questions:
1) How can learning be measured from multiple perspectives?
2) How can student and faculty perspectives be meaningfully compared?
3) How can evaluation frameworks reveal insights that separate surveys cannot?
4) How should differences in stakeholder perspectives be interpreted rather than simply reported?• Problem:
Student learning is experienced by students and observed by faculty, yet these perspectives are rarely examined within a common evaluation framework. As a result, institutions may miss important differences in how learning experiences are perceived.• Focus:
Developing a cross-stakeholder framework that provides an integrated view of student learning and helps identify perception gaps that cannot be identified from either survey alone.• What I Built:
Developed an evaluation framework that aligned related student and faculty survey measures into common domains, including learning expectations, engagement, academic support, belonging, instructional practices, and educational outcomes. The framework enabled systematic comparison across stakeholder groups and revealed perception gaps that were not apparent when each survey was analyzed independently.• Impact
- Enabled systematic comparison of student and faculty perspectives
- Identified areas of agreement and difference in perceptions of teaching and learning
- Helped identify priorities for improving the educational experience• Challenge:
Student and faculty surveys were developed independently rather than as parallel measurement instruments. Differences in wording, response scales, and perspectives required careful interpretation and limited some direct comparisons.• Future Development:
Develop measures of learning, examine changes in stakeholder perceptions over time, and explore how differences in perceptions relate to student outcomes.• Reflection:
This project showed me that no single perspective tells the whole story about learning. Bringing together student and faculty perspectives provides a more complete understanding than looking at each survey separately.
Longitudinal research · outcome measurement · PYTHON · spss syntax· trend analysis · cohort analysis · Subgroup comparison
Longitudinal Student Success Measurement Framework
• Problem:
Institutional leaders need more than institution-wide enrollment, retention, and graduation rates. They need to understand how student outcomes vary across specific populations and how those patterns change over time. However, historical student records were distributed across multiple operational systems and files with inconsistent structures, coding schemes, and definitions, making longitudinal analysis difficult. In addition, continuously updated institutional databases required repeated data extraction, integration, and preparation before meaningful subgroup analyses could be conducted.• Focus
The project follows a three-stage framework combining Python-based data extraction, AI-assisted longitudinal data integration, and researcher-led analysis and interpretation of student outcomes.The purpose of this project is to develop a longitudinal measurement framework for examining student pathways, persistence, academic performance, and institutional effectiveness across student cohorts and multidimensional subgroups.• What I Built:
Developed a longitudinal student outcome measurement framework through a three-stage research workflow:
1. Python-Based Data Extraction – Retrieved and prepared semester-level student records from institutional databases.
2. AI-Assisted Longitudinal Data Integration – Used Claude to standardize, merge, and reconcile more than ten years of admissions, enrollment, academic, demographic, financial aid, residency, housing, and graduation records into a unified longitudinal dataset, followed by researcher validation.
3. Researcher-Led Measurement and Analysis - Designed outcome measures, conducted multidimensional subgroup analyses, compared student populations, tracked longitudinal trends, and interpreted findings.The framework supports flexible analyses across individual and intersecting student characteristics, enabling comparisons of narrowly defined populations - for example, first-year residential students from New York with a college GPA below 2.5 - and monitoring changes in retention, persistence, academic performance, and graduation outcomes over time.• Impact
- Reduced manual data preparation
- Improved the consistency of longitudinal research
- Enabled multidimensional analyses across cohorts and outcomes• Challenge:
The project required integrating more than a decade of historical student records that contained changing data definitions, coding schemes, program structures, missing values, and duplicate records. Maintaining consistent cohort definitions and outcome measures across semesters required extensive validation, documentation, and quality checks before meaningful comparisons could be made.• Future Development:
Expand the framework by incorporating additional cohorts, student outcome measures, and institutional indicators while extending support for more flexible subgroup analyses and longitudinal reporting. Future enhancements may also include interactive reporting tools and standardized workflows that enable broader use by institutional researchers and decision-makers.• Reflection:
This project reinforced that meaningful longitudinal research begins with reliable data infrastructure. Advanced analytical methods are valuable only when underlying records, cohort definitions, and measurement rules are consistent, transparent, and reproducible. It also demonstrated the complementary strengths of human–AI collaboration: Python streamlined data extraction, Claude accelerated large-scale data integration, and researcher expertise remained essential for validation, measurement design, analysis, and interpretation.
Previous Projects
• Twitter Sentiment and Undergraduate Application Analytics
Examined the relationship between Twitter sentiment and undergraduate application trends. I developed an automated data pipeline to collect Twitter data, perform sentiment analysis, integrate it with admissions data, and visualize the results through interactive dashboards.Technologies:
Programming: Python, SQL
Cloud: AWS S3, RDS MySQL, Lambda, SNS, CloudWatch
Visualization: TableauGithub:
https://github.com/susanqisun/The-Impact-of-Twitter-on-University-Application
• Employee Attrition Prediction
Developed a predictive model for employee attrition. The following research questions guided this study:1) What are the relationships between attrition and other variables?
2) What is the best model to predict employees’ attrition?
3) Which features are most contributed to the response variable?Technologies:
Programming: Python, SQL
ML models used: Logistic Regresstion, SVM, KNN, Decision Tree, Random Forest, Bagging Model, Ensemble ModelGithub:
https://github.com/susanqisun/Employee-Attrition-Prediction
© Untitled. All rights reserved.